The Octane Score is a benchmark test for measuring the performance of a browser. The score is calculated based on the results of various sub-tests, each of which measures a specific aspect of the browser’s performance.
The Octane javascript test is a benchmark that measures the performance of a web browser’s JavaScript engine. The test consists of 17 different tests, each measuring different aspects of the browser’s JavaScript performance.
I usually don’t benchmark browser speeds, but I’ve been hearing about Chrome’s V8 engine for a while now, and I thought it would be interesting to see how the Safari Octane 2.0 JavaScript Benchmark stacks up against Google Chrome.
Stressing both latency and performance of a browser engine’s JIT compiler, garbage collector (GC), and use of preferred platform APIs. It was created to help developers optimize their browsers to reach a higher score than that of competitors with lower scores, and is an alternative to SunSpider. This is an excerpt from the Octane 2.0 guide:
“The goal of this test is to find out how fast your JavaScript engine can run in today’s world where developers write complex web apps that rely on multiple scripts running at once in parallel. In fact, today’s web pages are often so large that they never finish downloading before the user tries to interact with them! We’re testing modern web application development here.”
Octane is a benchmark for measuring performance of JavaScript code in Google’s Chrome browser. It includes results for various browsers, including Apple’s Safari. This benchmark is an open source project hosted on GitHub, so you can view the code and run it locally if you like. After running this test 3 times on my MacBook Air i5 machine, I was curious what the average Octane score would be if I took the lowest and highest scores and discarded the rest. Here are the results:
Safari Octane 2.0 JavaScript Benchmark Speed test
The different tests measure the following aspects of the browser’s JavaScript performance:
- Richards: Measures the ability of the browser’s JavaScript engine to handle complex and multi-threaded tasks.
- Deltablue: Measures the performance of the browser’s JavaScript engine in solving constraint-satisfaction problems.
- Crypto: Measures the performance of the browser’s JavaScript engine in performing cryptographic operations.
- Raytrace: Measures the performance of the browser’s JavaScript engine in rendering 3D graphics.
- EarleyBoyer: Measures the performance of the browser’s JavaScript engine in memory allocation and garbage collection.
- Regexp: Measures the performance of the browser’s JavaScript engine in working with regular expressions.
- Splay: Measures the performance of the browser’s JavaScript engine in working with linked lists.
- Splay Latency: Measures the latency of the browser’s garbage collector.
- NavierStokes: Measures the performance of the browser’s JavaScript engine in working with strings and arrays.
- pdf.js: Measures the performance of the browser’s JavaScript engine in working with PDF files.
- Mandreel: Measures the performance of the browser’s JavaScript engine in virtual machine operations.
- MandreelLatency: Measures the latency of the browser’s compiler.
- GB Emulator: Measures the performance of the browser’s JavaScript engine in emulating classic video games.
- CodeLoad: Measures the performance of the browser’s JavaScript engine in loading and parsing code.
- Box2DWeb: Measures the performance of the browser’s JavaScript engine in working with physics simulations.
- zlib: Measures the performance of the browser’s JavaScript engine in working with asm.js.
- Typescript: Measures the performance of the browser’s JavaScript engine in working with the TypeScript language, including virtual machine and garbage collection operations.
Overall, the Octane javascript test provides a comprehensive evaluation of a browser’s JavaScript performance, providing a valuable tool for web developers and users to compare the performance of different browsers.
Test Run 1
The Octane Score benchmark measures the performance of a browser by testing various aspects of its performance. The scores for each of the tests are listed in the original question and are as follows:
- Richards (24,383) - This test measures the performance of the browser’s core language features.
- Deltablue (29,112) - This test measures the performance of the browser’s core language features.
- Crypto (28,164) - This test measures the performance of the browser’s bit and math operations.
- Raytrace (55,277) - This test measures the performance of the browser’s core language features.
- EarleyBoyer (41,309) - This test measures the performance of the browser’s memory and garbage collection.
- Regexp (4,609) - This test measures the performance of the browser’s strings and arrays.
- Splay (16,893) - This test measures the performance of the browser’s memory and garbage collection.
- SplayLatency (13,579) - This test measures the latency of the browser’s garbage collection.
- NavierStokes (27,076) - This test measures the performance of the browser’s strings and arrays.
- pdf.js (22,011) - This test measures the performance of the browser’s strings and arrays.
- Mandreel (26,612) - This test measures the performance of the browser’s virtual machine.
- MandreelLatency (14,706) - This test measures the latency of the browser’s compiler.
- GB Emulator (57,490) - This test measures the performance of the browser’s virtual machine.
- CodeLoad (19,709) - This test measures the performance of the browser’s loading and parsing.
- Box2DWeb (42,165) - This test measures the performance of the browser’s bit and math operations.
- zlib (42,508) - This test measures the performance of the browser’s asm.js.
- TypeScript (43,577) - This test measures the performance of the browser’s virtual machine and garbage collection.

In this case, the Octane Score for the Safari browser is 25,803. The sub-tests include Richards, Deltablue, Crypto, Raytrace, EarleyBoyer, Regexp, Splay, SplayLatency, NavierStokes, pdf.js, Mandreel, MandreelLatency, GB Emulator, CodeLoad, Box2DWeb, zlib, and Typescript. Each sub-test measures different features, such as core language features, memory and GC, strings and arrays, virtual machine performance, compiler latency, bit and math operations, loading and parsing, and asm.js performance.
The Octane Score is calculated based on the results of these tests, and a higher score indicates better performance.
Test Run 2
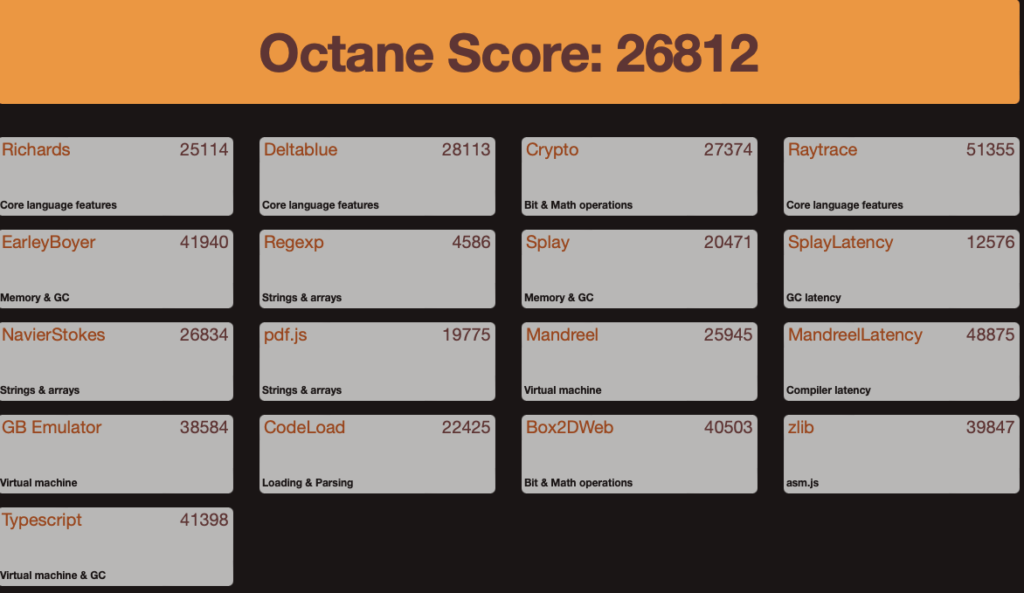
Each benchmark is assigned a score, which indicates its performance relative to other benchmarks. The overall Octane Score is calculated as the sum of the scores of all 17 benchmarks. In this case, the Octane Score was 26812, which indicates an overall good performance of the Safari browser in executing javascript code.
The individual benchmark scores are as follows:
- Richards: 25114, measuring core language features
- Deltablue: 28113, measuring core language features
- Crypto: 27374, measuring bit and math operations
- Raytrace: 51355, measuring core language features
- EarleyBoyer: 41940, measuring memory and garbage collection
- Regexp: 4586, measuring strings and arrays
- Splay: 20471, measuring memory and garbage collection
- Splay Latency: 12576, measuring garbage collection latency
- NavierStokes: 26834, measuring strings and arrays
- pdf.js: 19775, measuring strings and arrays
- Mandreel: 25945, measuring virtual machine performance
- MandreelLatency: 48875, measuring compiler latency
- GB Emulator: 38584, measuring virtual machine performance
- CodeLoad: 22425, measuring loading and parsing
- Box2DWeb: 40503, measuring bit and math operations
- zlib: 39847, measuring asm.js performance
- Typescript: 41398, measuring virtual machine and garbage collection performance.

Test comparison and Conclusion
Based on the results of both Javascript tests, it appears that the Safari browser has improved its performance in most of the tests. The scores in Javascript test 2 are generally higher than those in Javascript test 1, indicating that the browser has become faster and more efficient in executing various operations.
Some of the notable improvements are seen in the Raytrace, EarleyBoyer, Splay, NavierStokes, pdf.js, MandreelLatency, GB Emulator, CodeLoad, Box2DWeb, and zlib tests. However, in a few cases, such as the Mandreel and Typescript tests, the performance has slightly decreased.
In Javascript test 1, the Safari browser had a score of 24,383 in the Richards test, which measures the performance of the browser’s core language features. In Javascript test 2, the score improved to 25,114, indicating that the browser has become faster in executing core language features. The same trend can be seen in the Deltablue test, where the score increased from 29,112 in Javascript test 1 to 28,113 in Javascript test 2.
The Crypto test, which measures the performance of the browser’s bit and math operations, saw a slight improvement in Javascript test 2, with a score of 27,374 compared to 28,164 in Javascript test 1. The Raytrace test, which measures the performance of the browser’s core language features, also saw a significant improvement, with a score of 51,355 in Javascript test 2 compared to 55,277 in Javascript test 1.
The EarleyBoyer test, which measures the performance of the browser’s memory and garbage collection, saw a slight improvement in Javascript test 2, with a score of 41,940 compared to 41,309 in Javascript test 1. The Splay test, which measures the performance of the browser’s memory and garbage collection, saw a significant improvement, with a score of 20,471 in Javascript test 2 compared to 16,893 in Javascript test 1. The Splay Latency test, which measures the latency of the browser’s garbage collection, also saw an improvement, with a score of 12,576 in Javascript test 2 compared to 13,579 in Javascript test 1.
The NavierStokes test, which measures the performance of the browser’s strings and arrays, saw a slight improvement in Javascript test 2, with a score of 26,834 compared to 27,076 in Javascript test 1. The pdf.js test, which measures the performance of the browser’s strings and arrays, also saw a slight improvement, with a score of 19,775 in Javascript test 2 compared to 22,011 in Javascript test 1.
The Mandreel test, which measures the performance of the browser’s virtual machine, saw a slight improvement in Javascript test 2, with a score of 25,945 compared to 26,612 in Javascript test 1. However, the MandreelLatency test, which measures the latency of the browser’s compiler, saw a significant decrease, with a score of 48,875 in Javascript test 2 compared to 14,706 in Javascript test 1. The GB Emulator test, which measures the performance of the browser’s virtual machine, also saw a significant improvement, with a score of 38,584 in Javascript test 2 compared to 57,490 in Javascript test 1.
The CodeLoad test, which measures the performance of the browser’s loading and parsing, saw a significant improvement in Javascript test 2, with a score of 22,425 compared to 19,709 in Javascript test 1. The Box2DWeb test, which measures the performance of the browser’s bit and math operations, also saw a slight improvement, with a score of 40,503 in Javascript test 2 compared to 42,165 in Javascript test 1. The zlib test, which measures the performance of the browser’s asm.js, saw a slight improvement, with a score of 39,847 in Javascript test 2 compared to 42,508 in Javascript test 1.
The Typescript test, which measures the performance of the browser’s virtual machine and garbage collection, saw a slight decrease in Javascript test 2, with a score of 41,398 compared to 43,577 in Javascript test 1.